Have you noticed that clients have rapidly rising expectations for the design and “look” of market research reports? Many of us in the market research & insights profession have, and it can be a painful realization. Indeed, “I’m supposed to be a market researcher and a graphic designer?!”, is a sentiment I have heard many times the past few months.
Unfortunately, when we are working to meet project deadlines, it’s hard to take time to step back, and really evaluate our current reporting style. But how long can we delay? At what point will dated-looking deliverables negatively impact our work and work relationships?
The “bad news” is that I do know many market research & insights teams that really need an update this year. I have some urgency about this, because right now as a profession (both corporate research and supplier teams apply) we are evolving to thrive in a data-fluent, data-driven decision making ecosystem. And unfortunately, this comes with new expectations and higher standards for business-ready PowerPoint documents.
Our goal is to avoid risking the situation where a dated-looking report casts a “dated” halo over our research. “If my researcher can’t put together a modern, business-ready PowerPoint report, maybe they have other outdated skills, too”, is not a message any of us want to hear.
The good news! PowerPoint reports designed to current standards can meet higher expectations and improve engagement—ultimately what we all want, right? We want the client/reader to engage with the research, understand it, and retain its key points. Current design standards appeal to our notoriously busy, multitasking, on-the-go audience.
What Makes a PowerPoint Report “Modern” or “Current”?
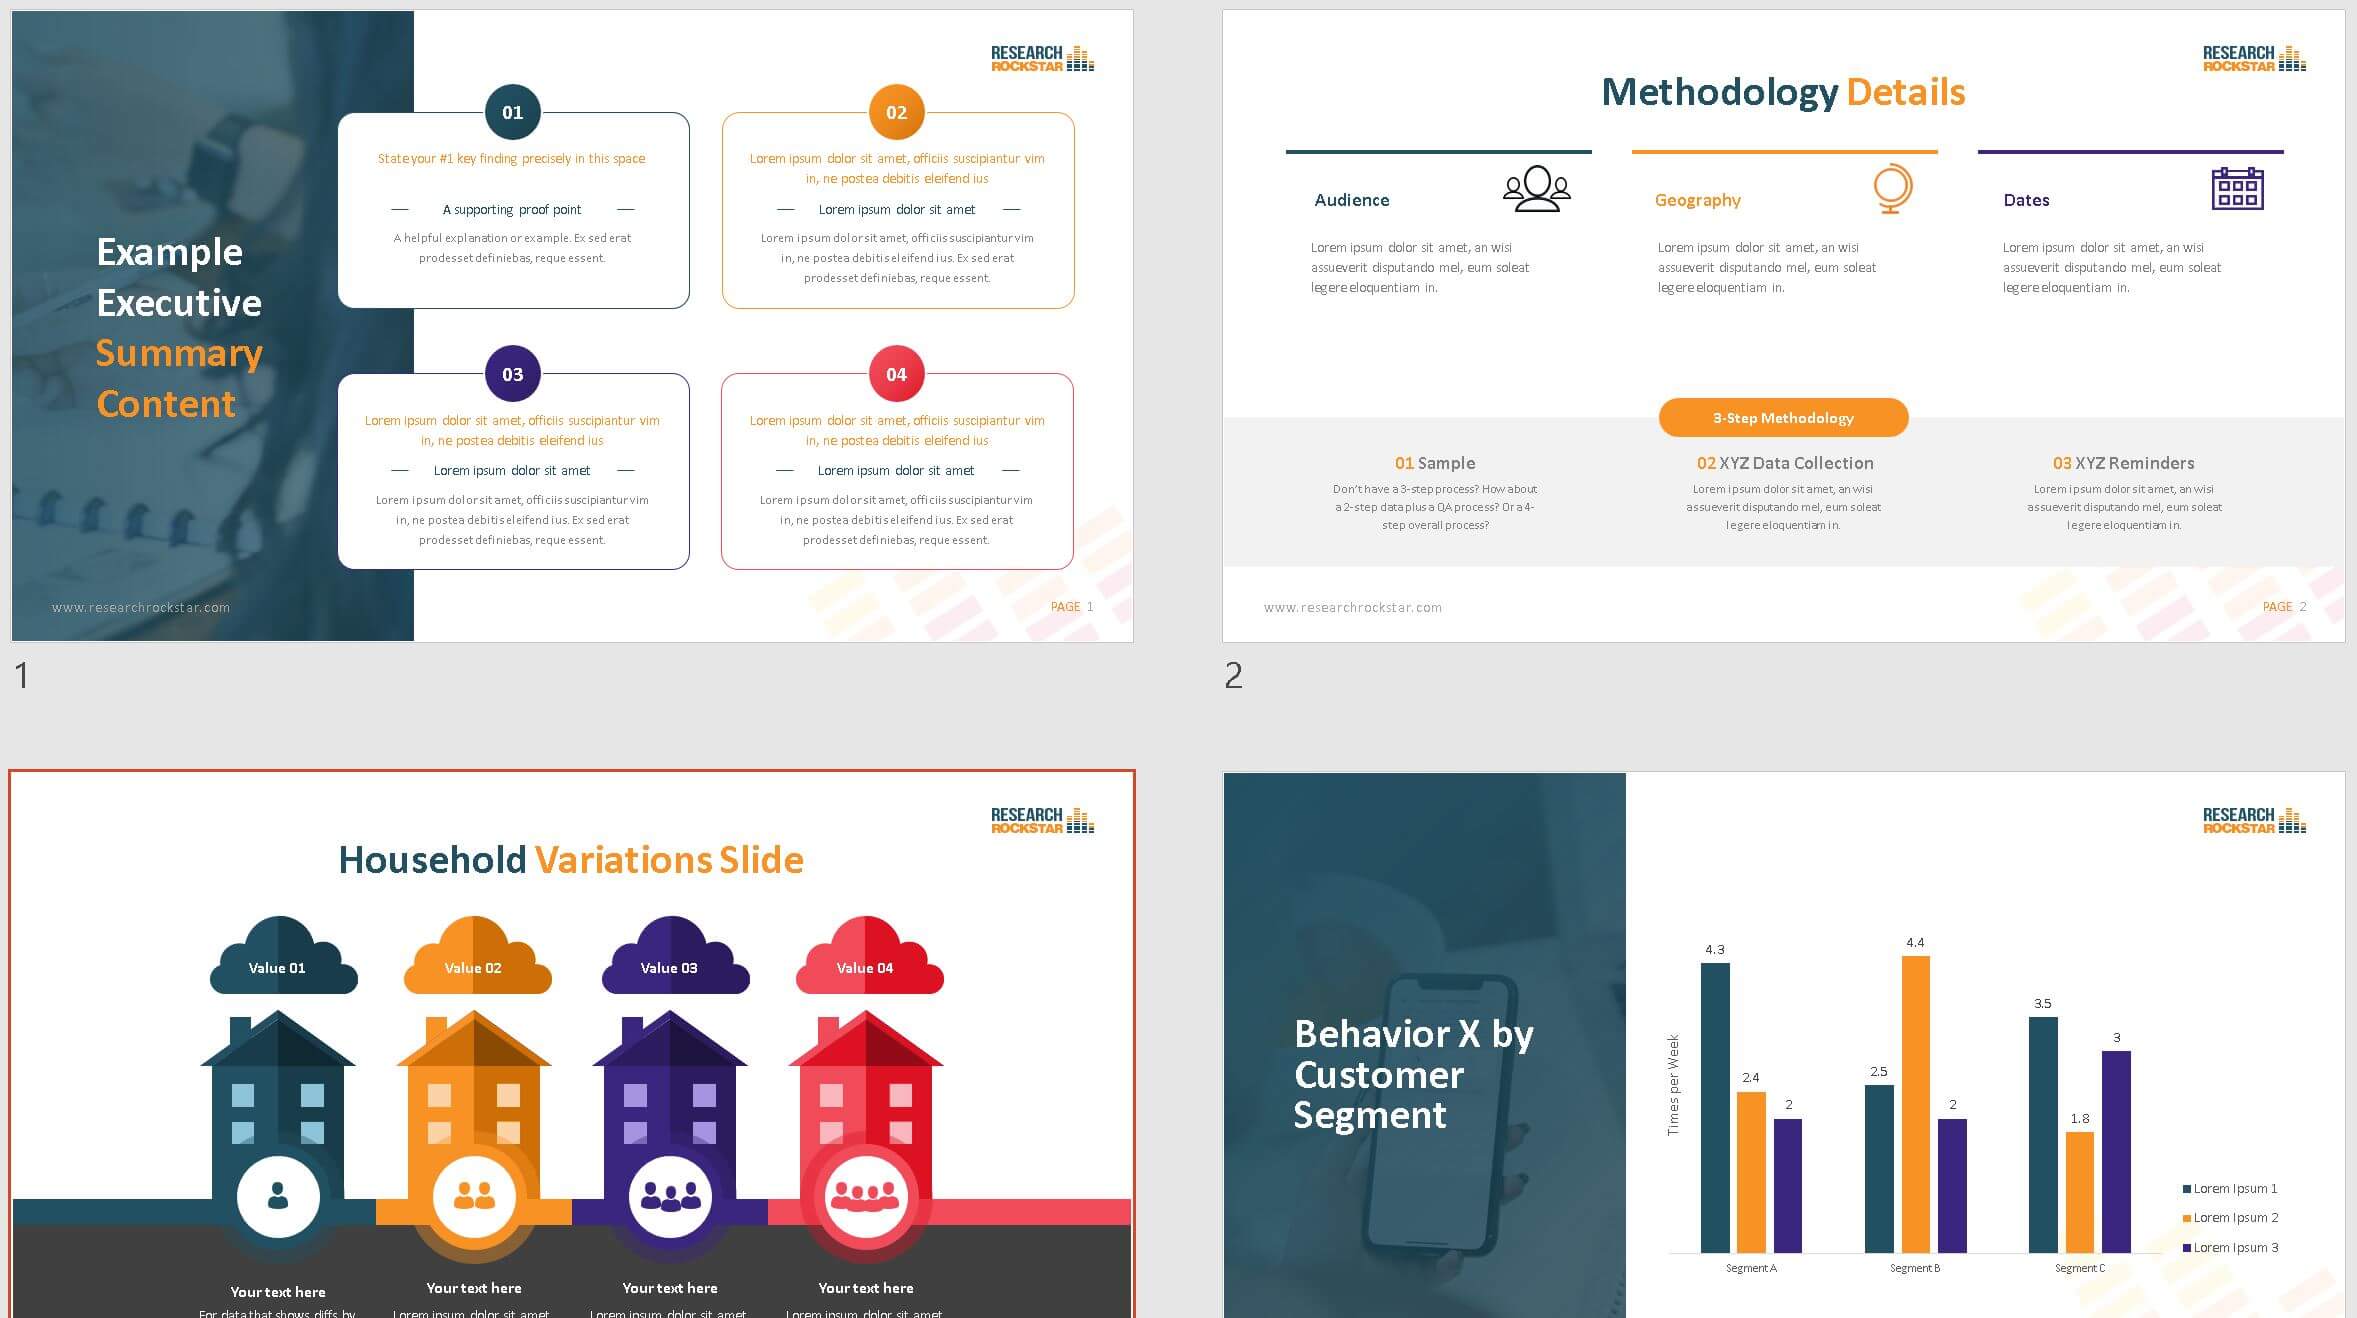
Consider the examples in this short video, and then take a look at this report from Accenture and this one from KPMG. Notice how these examples incorporate the following style elements:
- Multiple column layouts. In contrast, dated-looking PowerPoint reports tend to over-rely on a single column format.
- Graphics that amplify the story. Modern-looking PowerPoint reports use graphics to help the reader get quickly oriented to your analysis.
- Icons and color to accentuate key points. Notice the use of “flat” icons and bold (not muted) colors.
I’m not saying either of these examples is a “perfect” report (I don’t care for some of the data visualizations), but they have look and style attributes that can inspire your report style refresh. Also, the Accenture and KPMG examples are a bit more “thought leadership” in style than a standard research report—but not by much. Also, these are “reading” style reports—not ones meant for presentations. Caveats aside, for guidance on what makes a PowerPoint report modern by today’s standards, these are good examples.
Would Your Clients Describe Your Reports as “Modern”?
If you aren’t sure, here’s a simple self-test. Thinking about you most recent report, what percent of the pages could be described as having these attributes:
- One blocky column of text
- One slide-filling chart with a headline
- Tired stock art
- Photos or images that are randomly or poorly positioned (like stretched-out/distorted photos, the random picture squeezed into a corner, or “floating” people).
Of course, in moderation, A and B are fine. But if over half your slides can be described as having at least one of these A-D attributes, that’s a sign your reporting style needs an update.
If you flunked the self-test, don’t worry, you aren’t alone. Researchers generally aren’t graphic designers (and vice versa—we’re all good at something!). And while creating these clean and modern masterpieces is no easy task, the good news is that many of us can significantly up our game just by having an awesome PowerPoint template as a starting place.
A PowerPoint Template to Get You Started…for Free!
Sometimes, the hardest part of tackling a tough task is getting started. And we get that. So, I had my favorite PowerPoint guru create this awesome 15-slide PowerPoint template you can use either as an example for what to look for in a new template, or to use directly (a lot of people are getting this file, so if you use it in your reports, be sure to at least customize the “color palette” and images). Students in the upcoming Research Rockstar report writing courses (both the Writing Quantitative and Writing Qualitative reports courses) will be getting a 57-slide version of this file.
Agree? Disagree? Please comment. And as always, I am happy to have conversations about all things market research. Just make an appointment with me.
P.S. Do you have any modern reporting examples you’d like to share with your fellow Research Rockstars? Maybe your own, or public domain? If so, please do contact me. If I get at least three great samples, I will publish a “Part 2” with links so we can all work together to advance our profession’s reporting quality.